
Shoreline Studios was a startup founded near the beginning of 1995 by Tim Heidmann (CEO) and me, Wade Olsen (Principal Scientist). I was responsible for all software engineering. The video below shows highlights of Shoreline Studios: FoxTrax hockey puck tracking system, Mr. Map for CBS elections coverage, ESPN’s PrePlay for football strategy analysis, ESPN’s VRX for the Summer and Winter X-games, GolfTrack, and Rocket Pad.
FoxTrax
The hockey puck tracking system used by Fox Sports, starting in 1996, was one of those projects that, had we any idea how hard it would be, we would never have gotten involved. For this project our company, Shoreline Studios, was responsible for several software applications.
First, scattered throughout the arena were infrared (IR) cameras that looked for the puck. At each IR camera location was a PC running software I wrote that looked for bright spots in the images coming from the attached camera. Each bright spot was analyzed and important attributes of each spot, for each frame of camera video, were sent to a central Silicon Graphics (SGI) computer.
Second, the central SGI computer ran a program I wrote (most of) that, after collecting bright spot data from each IR camera, analyzed all the data together to determine which of those bright spots was the hockey puck. This process involved a lot of filtering and hand-wringing and was one of the hardest parts to get working properly. The difficulty here comes from inaccuracies of all the data collected, and from other sources of infrared light reflecting off the ice. When trying to line up bright spots from different cameras, they often did so reluctantly. Once the 3D location of the puck could be determined, the computing continues…
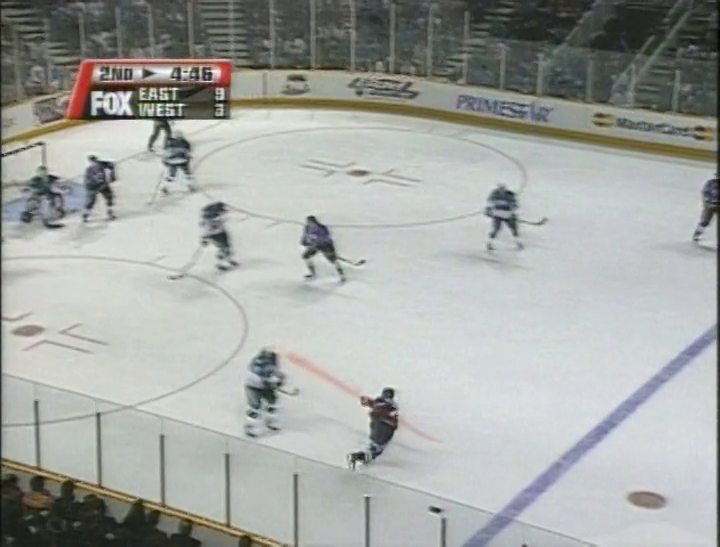
Third, the SGI computer also monitored the main video production switcher to determine which broadcast camera was currently on air. The SGI also collected information detailing where each of the broadcast cameras were currently aiming and what its zoom setting was. With all this, the SGI could compute where in the video frame the puck must be and to draw the “puck effect” there. This latter part of the software was written by Tim Heidmann and included the comet trail effect and putting up text graphic showing the measured puck speed for fast slapshots.
In order for all of the above to work properly, the SGI computer needed to know precisely where each IR and broadcast camera was located and how they were oriented. To determine this a lengthy (and painful) registration process was used… every time the system was set up in an arena (after each game the system was torn down, packed up and carried off to the next game). For the broadcast camera this involved aiming the camera at precisely surveyed locations on the ice, and the SGI noting the pan and tilt values associated with each surveyed location. After collecting these the SGI would solve a bunch of simultaneous equations, attempting to find the spot where all those pan and tilt values made sense.
For the infrared cameras, which are rigidly fixed in place, a flashing IR puck was carried from surveyed spot to spot, noting the position of the bright spot in each camera’s IR video frame. A similar computation as above was done to determine each IR camera position and orientation. Further complicating matters, none of the lens (IR or broadcast) produced a perfectly square image. They all distorted the image in various ways. Our colleague JR Glaudemans developed a process for characterizing the distortion of the lenses. For the broadcast lenses this was quite involved because varying the zoom or focus altered this distortion. JR also wrote the entire user interface that controlled this very complicated system.
For a detailed description of how FoxTrax works and how it came to be, from conception to going “On Air,” see this excellent article by Rick Cavallaro, another major contributor to the project.